

1930 - 2014 Soccer World Cup Tournament Data Analyzed


We are back with another exciting data analytics project. As expected, the processes went a bit smoother than in the previous projects. This is a testament to the saying ‘practice makes perfect.
The Task
This week, we have a soccer-themed project. We are to perform a football world cup analysis, using data from 1930 till the present. The expected steps include data scraping, data cleaning, and data visualization via Power BI. The instructions specified that our dashboard must contain the following data: • Number of World Cup Winning Titles • Attendance, Number of Teams, Goals, and Matches per Cup • Goals Per Team Per World Cup • Matches With the Highest Number of Attendance • Stadium with Highest Average Attendance • Which countries had won the cup • Number of goals per country • Match outcome by home and away teams
The Data
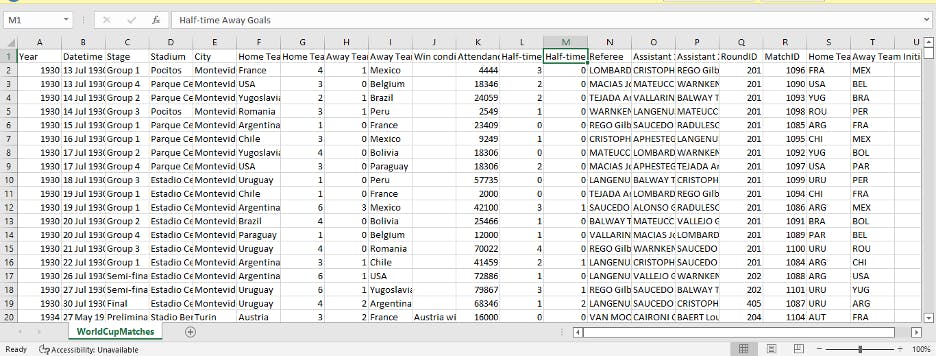
The data were obtained from a verified web source. The data obtained include 3 comma-separated value (CSV) files. The file containing information about players/coaches was discarded, as it contains no data of interest. The two other files contain data about the world cup matches and world cup winners respectively. The file “WorldCupMatches” contains 20 columns and 852 rows of data while “WorldCups” contains 10 columns and 20 rows. Both files were taken through data cleaning processes.
Data cleaning
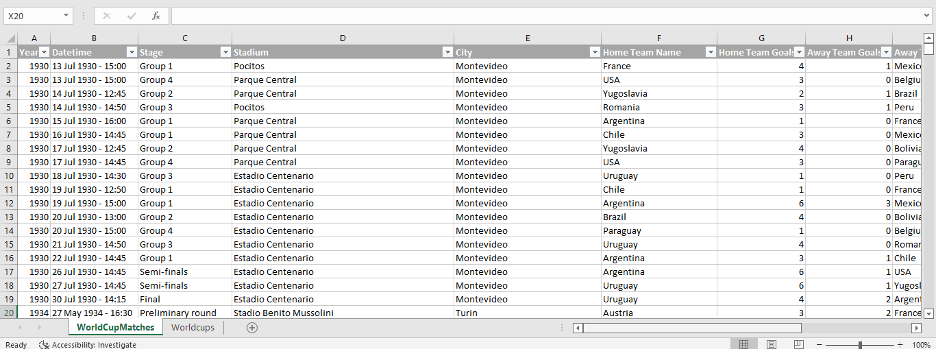
Again this week, we had two teams, the cleaning process was done majorly on Microsoft excel, then some minor transformations and querying on PowerBI. Team One processed the data this way: • Put the Worldcup matches dataset in a table named matches • Found and removed 16 duplicates • Removed a column named win conditions because the entries are below 10% of the total rows • Put the WorldCups table in another sheet on the same excel. Checked for the relationship between the tables. • Created a calculated column for total goals, and a new column for each tournament (host country and year) • Created a new column for matches (home and away teams) and a column for match outcome (home and away team and scores).
Team 2 cleaning processed it slightly differently, they created a "matchID" for every Match and then • Removed duplicate fixtures through match id • Subtracted away goals from home goals to get the fixture goal difference column • Duplicated the World Cup matches table to create the cup winners table ; • Filtered the stage column to the final • I added a conditional column that referenced the fixture goal difference of the final games to determine the winner of each World Cup. • Merged queries to bring the World Cup winner column into the World Cup matches the table.
Then on to visualizing.
Analysis and Visualization
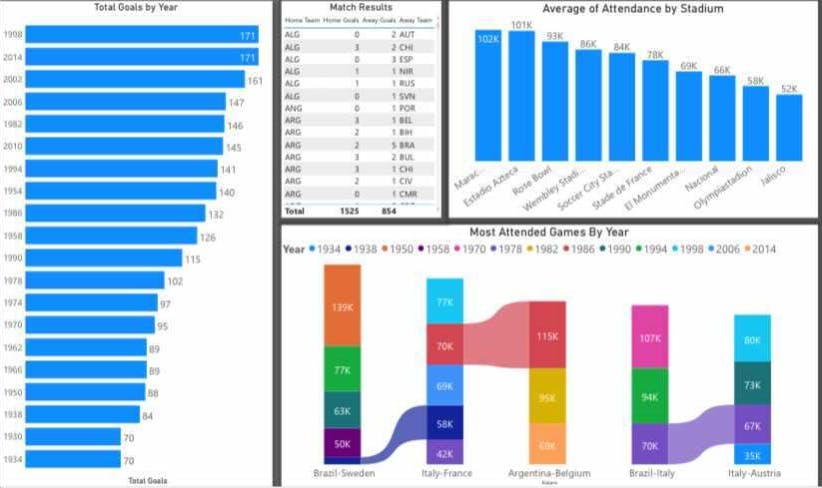
The data was loaded into Power BI to create a dashboard that illustrates the information of interest. The first dashboard image shows the winning countries from 1934 to 2014. A total of 2379 goals were recorded, of which 1525 were home and 854 away. Brazil has the highest number of goals, home and away. The attendance per year was also visualised. The highest attendance was recorded in 1994 while the lowest was in 1934. The number of fixtures per year is presented in the dashboard.
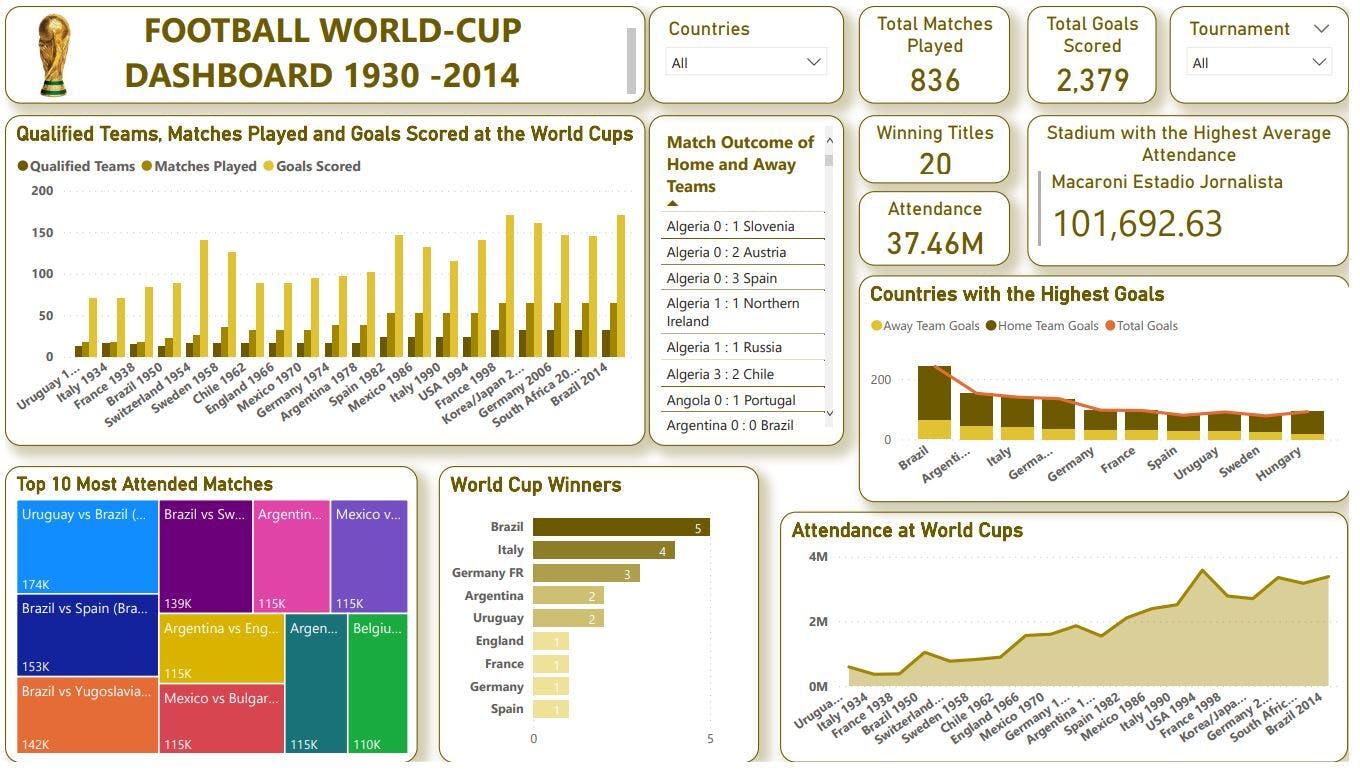
Cards
• Total matches played • Total goals scored • Winning titles – number of times the cup has been won. (Question 1) • Total attendance of every stadium of every World Cup Match played • Stadium with the highest average attendance (Question 4)
Slicer – world cup years
Charts
• Number of teams, goals, and matches played per cup (question 2) • Table showing the scores between home and away teams across the years( question 8) • Countries with the highest goals showing the goals per country( question 7) • Highest attendance at matches (question 5) • All Worldcup winners from highest to lowest (question 6) • Attendance per cup (question 2)
The Second Team dashboard image visualizes Cards, Tables and Charts.
Cards
• Home team goals • Away team goals • Total goals (A New Measure ); Total goals = sum(worldcupmatches[Home team goals])+sum(worldcupmatches[away team goals])
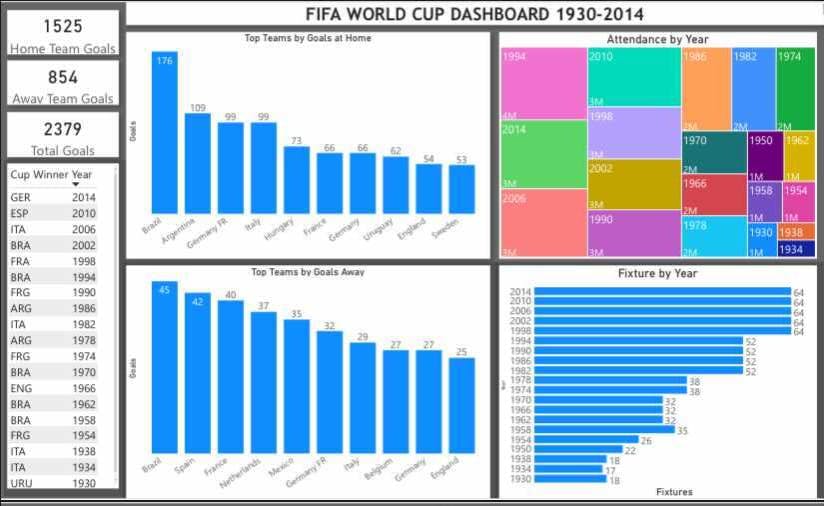
Tables and Charts
• Table showing each year's World Cup winner • 2 Stacked column charts for most goals scored by the top 10 teams at home and away. • A treemap chart for the number of attendees for each World Cup year • A stacked bar chart for the number of games played ( fixtures) each World Cup year. • A stacked bar chart that shows the totals goals scored in each World Cup year • A match results (match outcome) table • A stacked column chart that shows the average number of attendees ( top 10) per stadium • A ribbon chart for the most attended fixtures( Top 5) in World Cup
Sadly, we could not in the project allocated time figure out the right DAX expressions to help us on how to distinctly report Goals-per Team per World Cup on PowerBI (even though it was quite easier on my personal favourite tool - Miccrosoft Excel) so if you have Ideas, do reach out, my Team and I are eager to learn.
Thank you for your time. We’ll be back with another intriguing data analytics project story.