


Getting this data was a breeze, and almost everyone had fun and that's a bit awkward to say because we're dealing with Suicide here.
THE TASK
"Work on Global suicide rate Insight Analysis from 1985 till 2016.
Your analysis must have these features/specifics
- Country
- Year: from 1985 to 2015
- Sex
- Age : Age groups including “5-14”, “15-24”, “25-34”, “35-54”, “55-74”, and “75+”.
- Suicides_no : Number of suicides
- Population
- GDP_per_capita ratio between the country’s GDP and its population
- Continent
- Apart from those, create another variable called suicides_per_100k which is obtained by dividing Suicides_no by population"
We easily found any open-sourced data showing these in one place so we took the one we found on Kaggle that had most of the parameters we were to track.
THE DATA
The data is a proper excel (.xlsx) file with one worksheet containing 13 columns and 27821 Rows, gathered from 1985 to 2016.
Column Titles in the order they were arranged are:
- Country
- Country_count
- Year
- Sex
- Age
- Suicides_no
- Population
- Suicides/100k pop
- Country-year
- HDI for year
- gdp_for_year ($)
- gdp_per_capita ($)
- Generation
- Generation_Count
- Continent
- Continent_count
Don't worry, I will explain the italicised ones in a bit, just follow.
THE CLEANING PROCESS
The cleaning was done on Microsoft Excel before we divided ourselves into 3 groups; One for Excel and 2 for PowerBI (I functioned across teams as the Team Lead though), and although the Excel team didn't finish in time for submission, we made a good trial indeed, you'll love it in its incompleteness too.
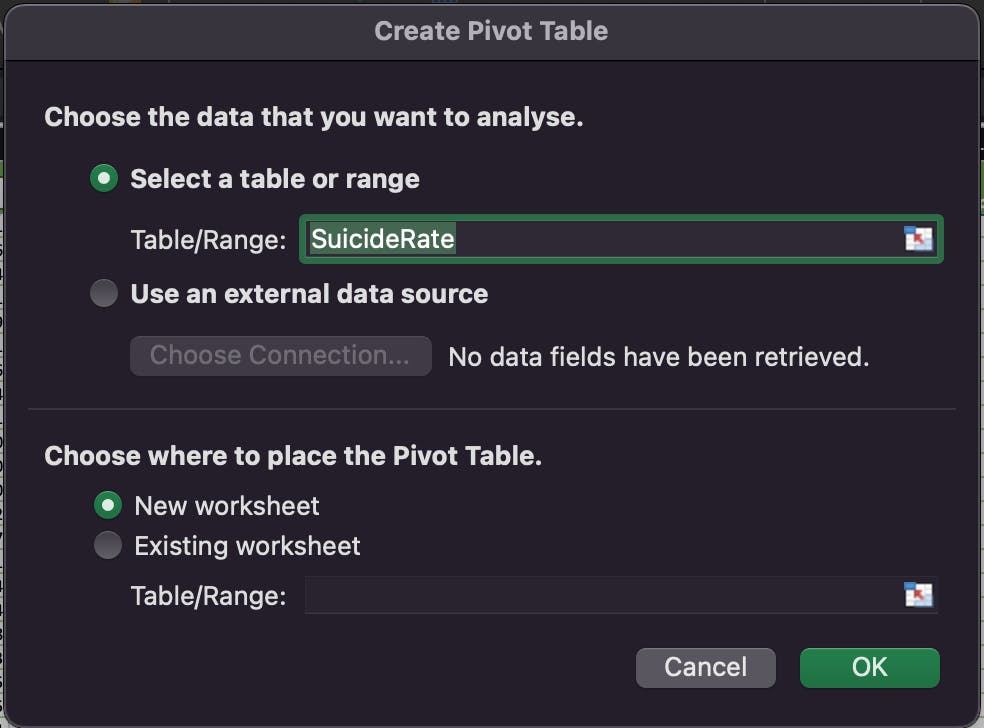
During the cleaning on Excel, No Duplicate Values were found, we adjusted/changed Data Types accordingly, then created and renamed the raw data Table as "SuicideRate".
We on Excel proceeded to create 3 extra columns as we noticed MacBook Excel versions don't have the "Add this data to the data model" option when creating a Pivot Table, hence, we can't have the "DISTINCT COUNT" option in the pivot table "summarize value field by" option and no access to power pivot too to count individual unique data of the columns we created them for, as compared to newer versions of Excel on Windows PC. Like so....
... as compared to ...
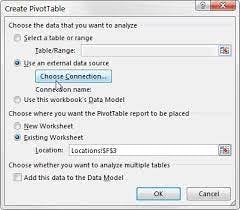
The distinct count option on Microsoft PC's Excel looks like so...
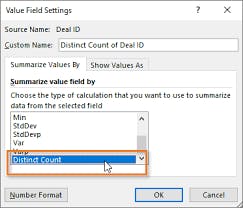
This simple adjustment had us using the below formula to count distinct values.

Fun ride yeah? I told You.
THE VISUALIZATION AND DASHBOARD
The Data was then Uploaded to PowerBI to create a simple yet effective dashboard to define the diverse valid insights seen by each team.
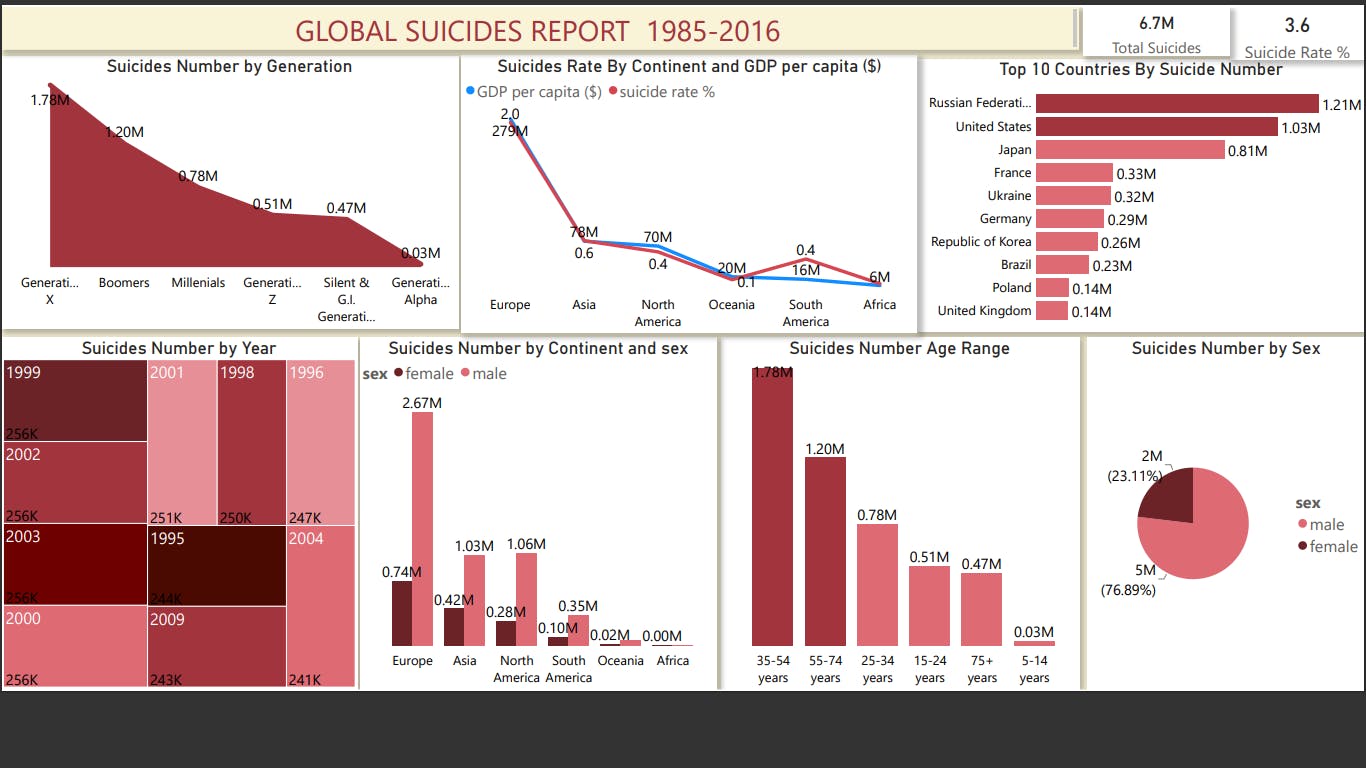
The first Dashboard by one of the PowerBI team had: 2 cards showing:
- Total suicides
- Suicides rate % ( Total suicides/population)
2 area charts:
- Suicides number by generation
- Suicides rate by continent and gdp per capita($)
A Stacked bar chart:
- Top 10 countries by suicides number
A Treemap:
- Suicides number by year
A Clustered column chart:
- Suicides number by continent and sex
A Stacked column chart:
- Suicides number by age range
And a Pie chart:
- Suicides number by sex
The Second Dashboard by the second PowerBI team is:

Basically, nearly similar details are in purple.
2 Cards, 1 Area, 1 Line, 1 Column and 1 Bar chart.
The Incomplete Third Dashboard from the Excel team showed this:
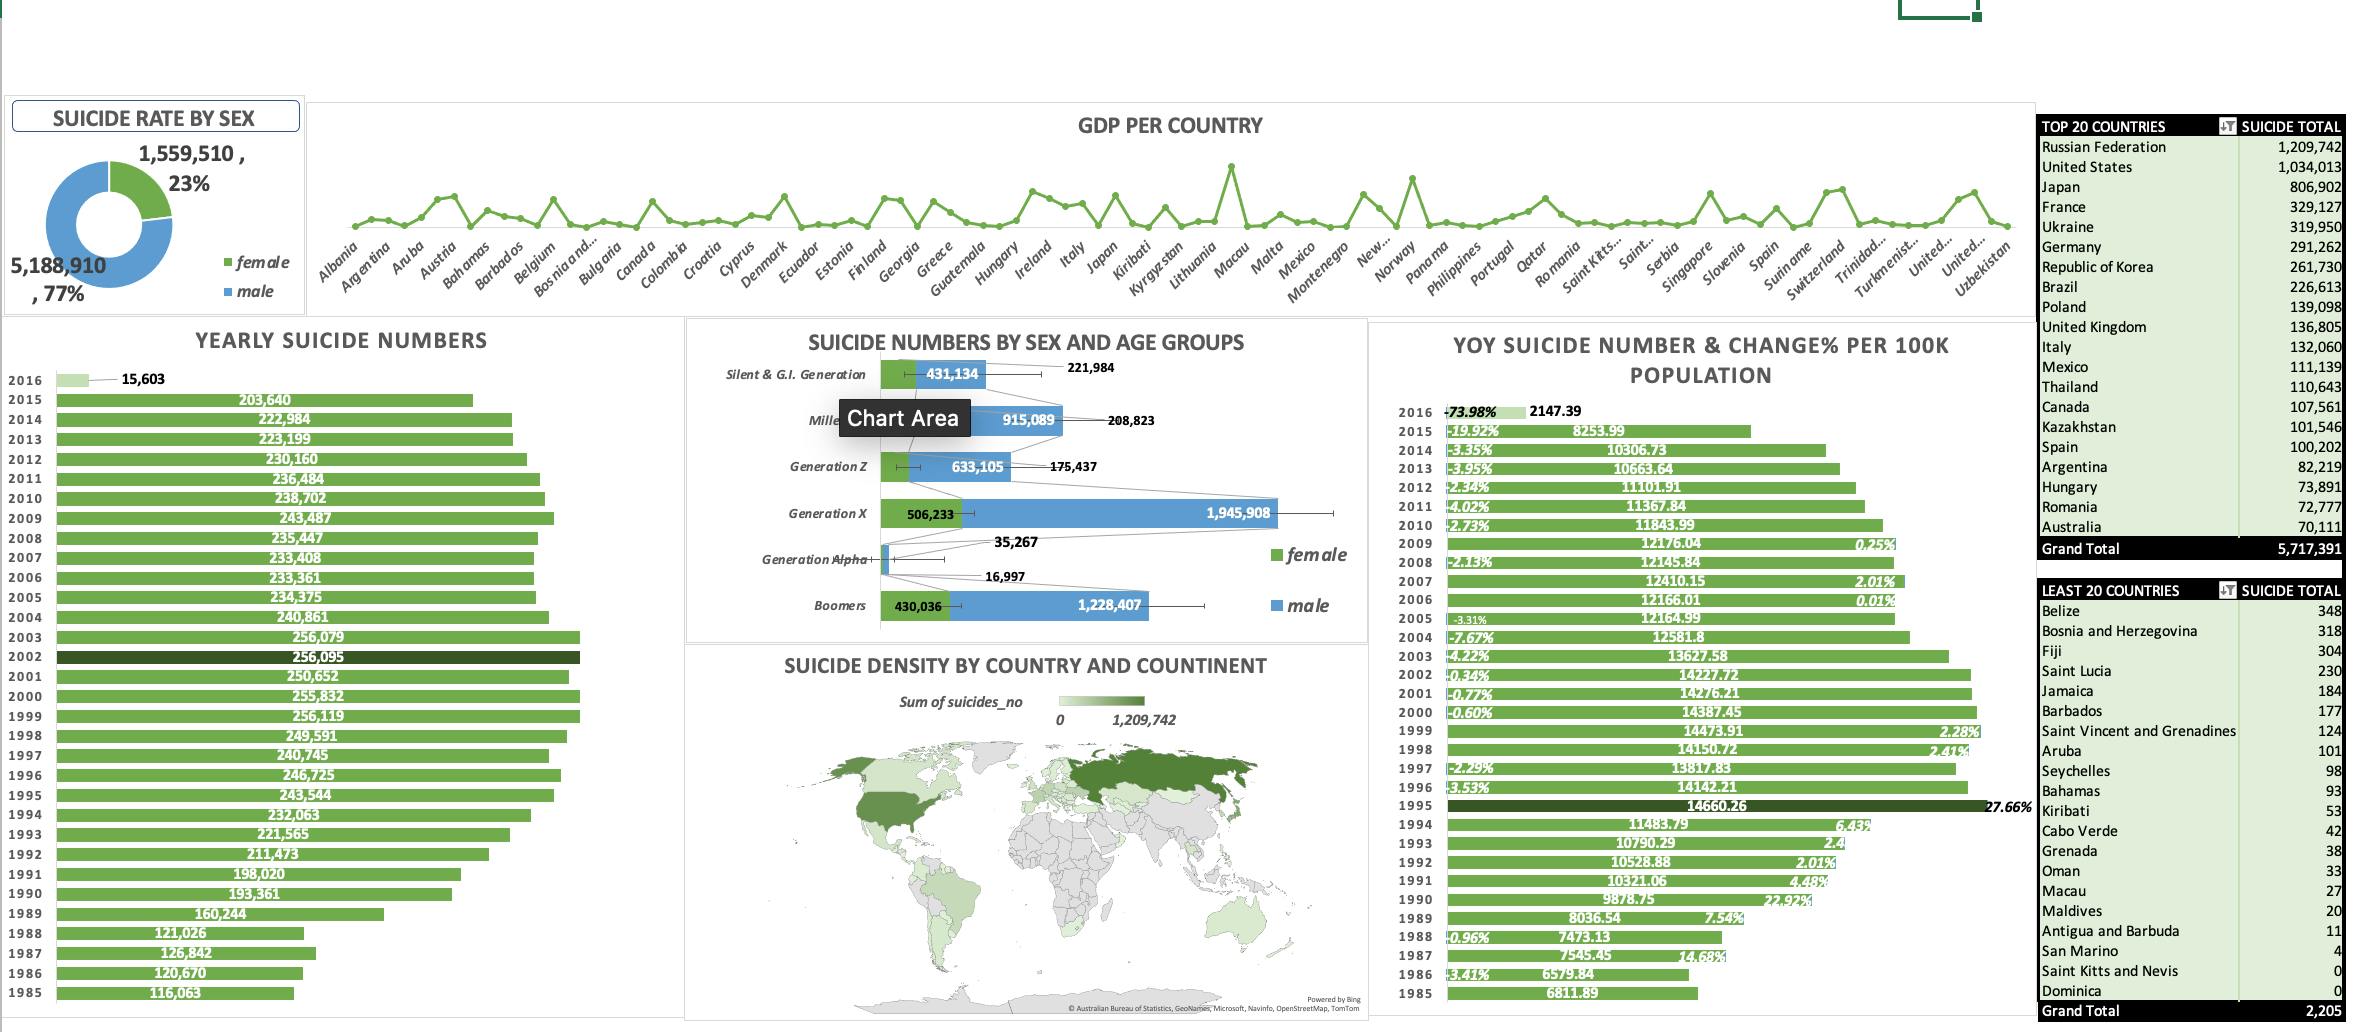
It is obvious we had a bright idea here, we were just slower on execution. Has No Cards, 1 Doughnut, 3 Bar Charts, 1 Map Chart (which was quite frustrating to create since we could not create from a Pivot table), 1 Top N table, and 1 Bottom 2 tables.
Thank You for taking the time to go through the good works of my team's hands and how we think when we see data.
Enjoy.