


THE TASK
Work on a Life Expectancy Insight Analysis on a selected country. Your analysis should answer the following questions.
- Does various predicting factors which has been chosen initially really affect Life expectancy? What are the predicting variables actually affecting life expectancy?
- Should a country having a lower life expectancy value(<65) increase its healthcare expenditure in order to improve its average lifespan?
- How do Infant and Adult mortality rates affect life expectancy?
- Does Life Expectancy has positive or negative correlation with eating habits, lifestyle, exercise, smoking, drinking alcohol etc.
- What is the impact of schooling on the lifespan of humans?
- Does Life Expectancy have a positive or negative relationship with drinking alcohol?
- Do densely populated countries tend to have a lower life expectancy?
- What is the impact of Immunization coverage on life Expectancy?
Hmmmm, we're about to find out ooh.
THE DATA
The data is a Comma Separated Value (.csv) file with one worksheet containing 13 columns and 27821 Rows, gathered from 1985 to 2016.
Column Titles in the order they were arranged are:
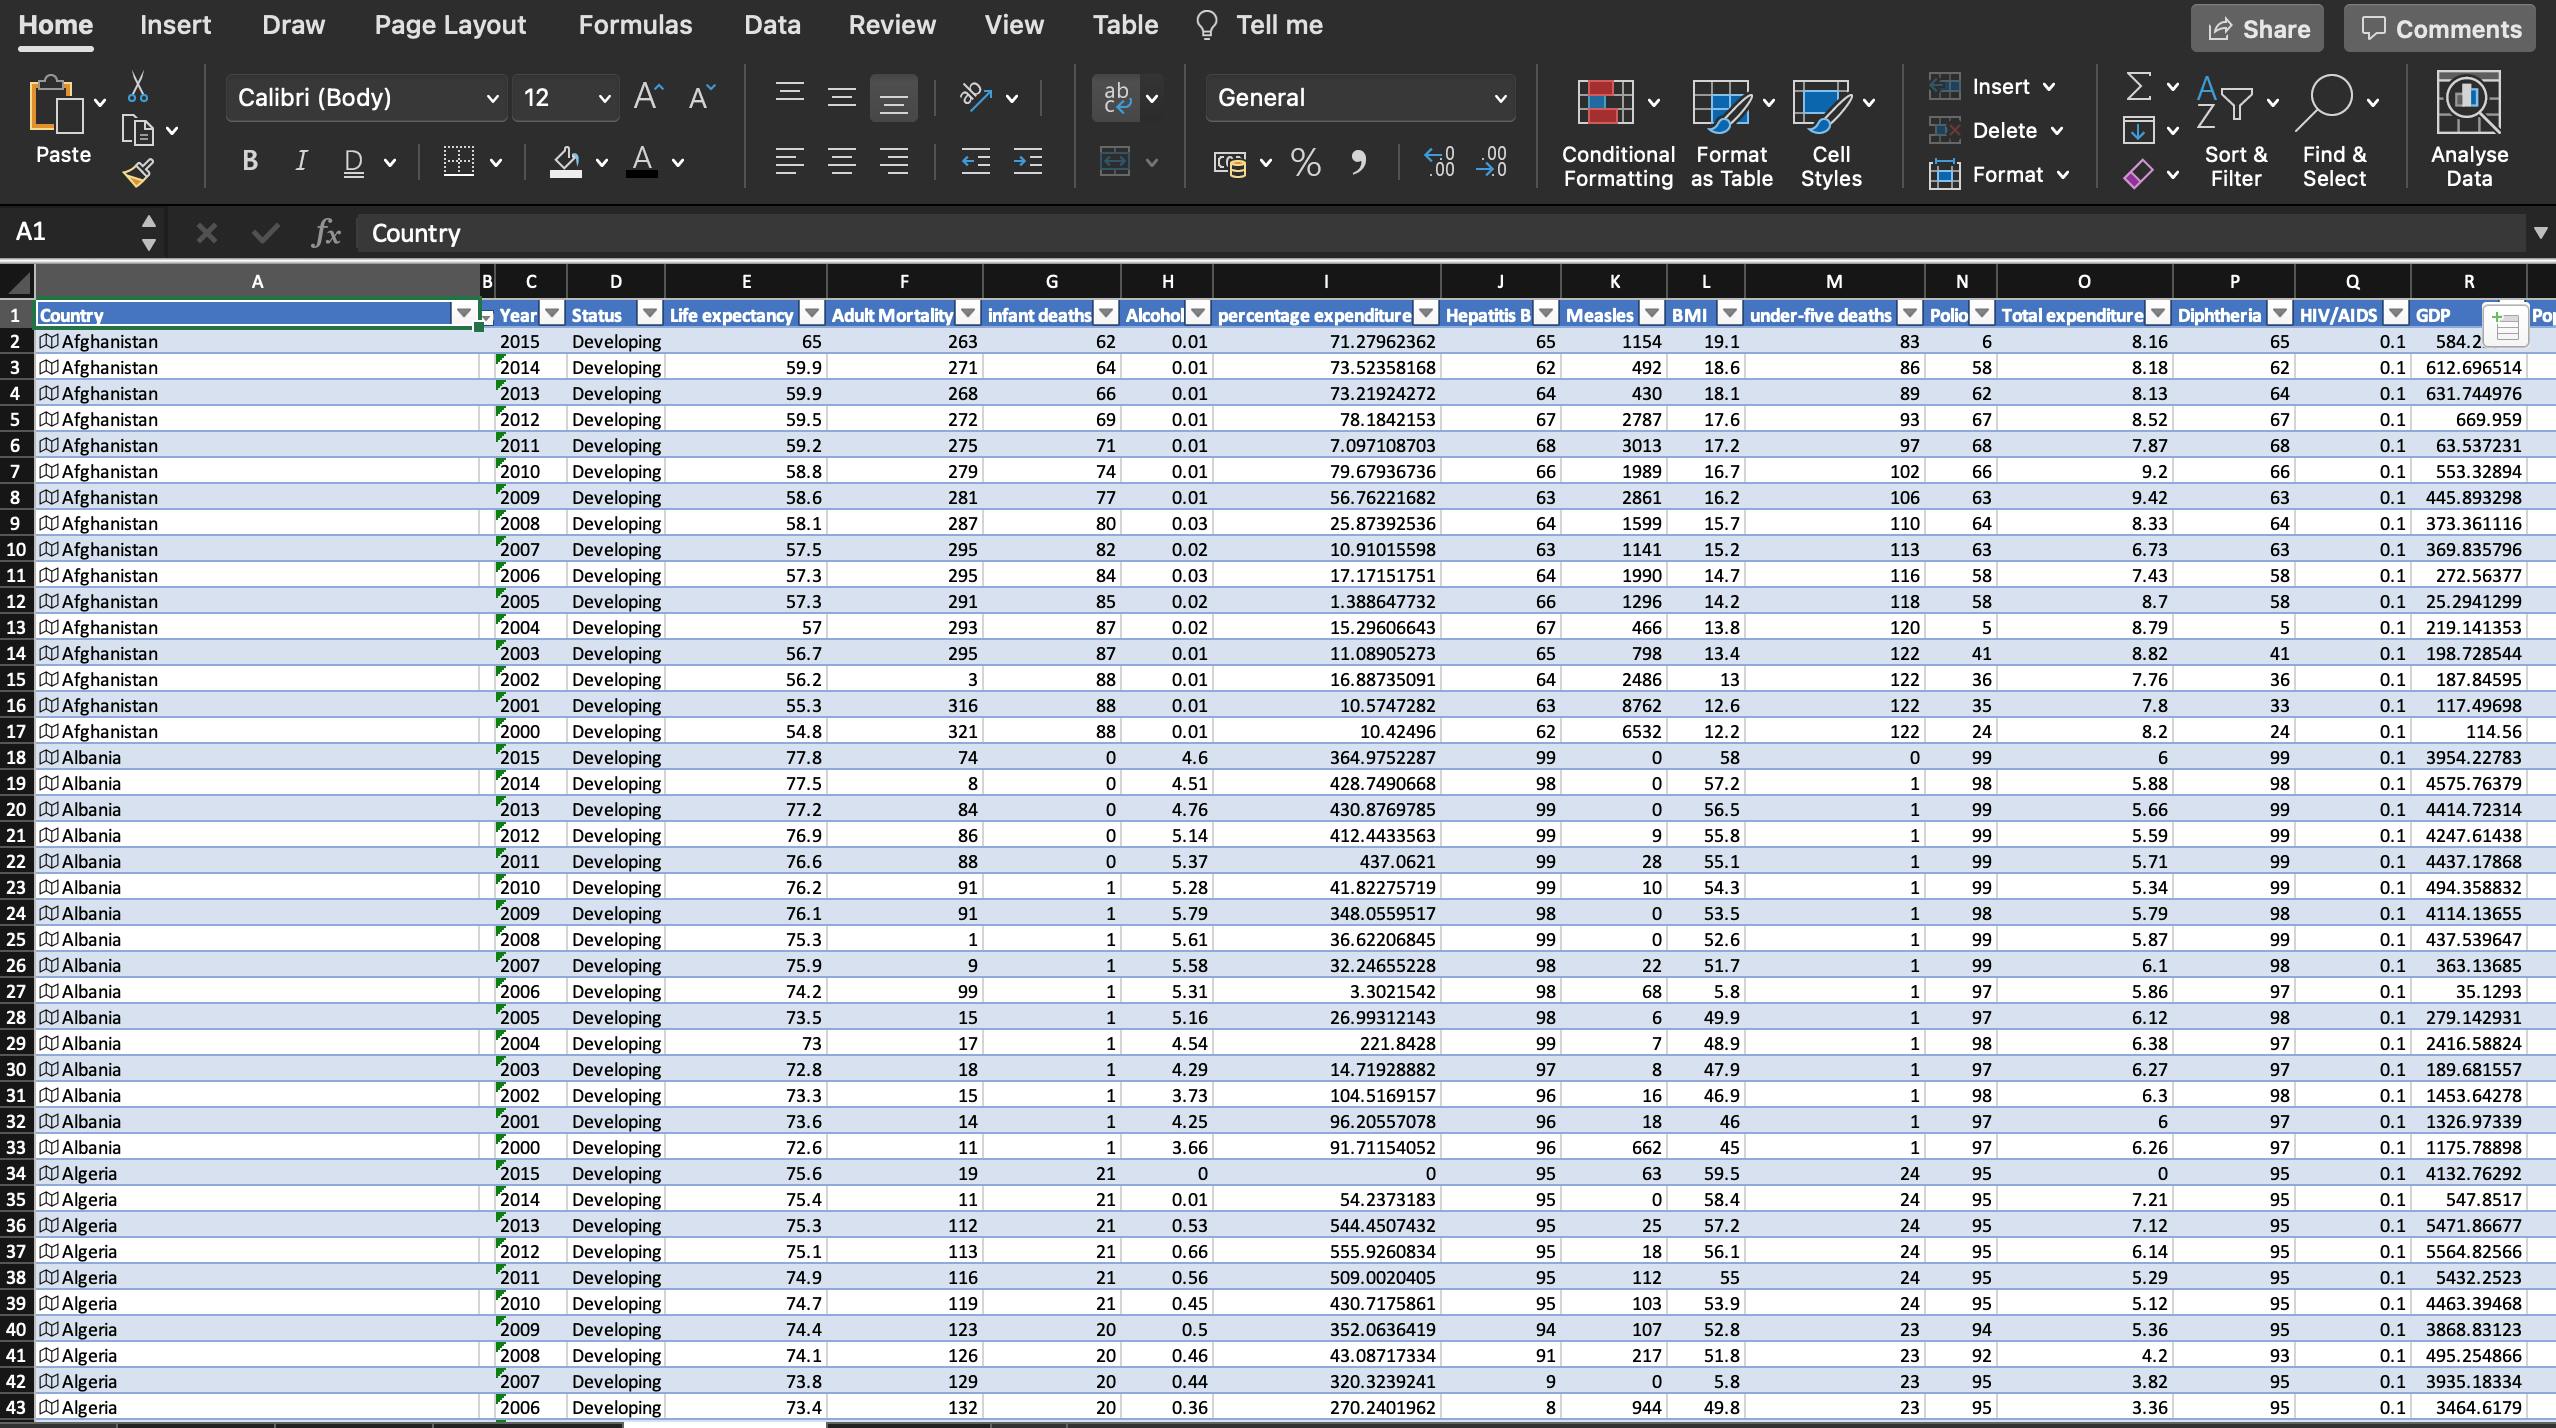
- Country
- Year ('2000 - 2015')
- Status
- Life expectancy
- Adult Mortality
- Infant deaths
- Alcohol
- percentage expenditure
- Hepatitis B
- Measles
- BMI
- Under-five deaths
- Polio
- Total expenditure
- Diphtheria
- HIV/AIDS
- GDP
- Population
- Schooling
THE CLEANING PROCESS
The cleaning was done on Microsoft Excel before we moved it to PowerBI. On Excel, No Duplicates were found, "Côte d'Ivoire" became Ivory Coast, Used the Trim function on Year Column as it had spaces on few of them.
We did a Distinct count of the countries using the 1/COUNTIF formula in an inserted column names CountryCount to increase the number of columns to 20 and get an accurate count of all the countries in the data (193). Then finally, replaced 2,561 Blanks in ranges of columns that are of Numbers data formats with 0.
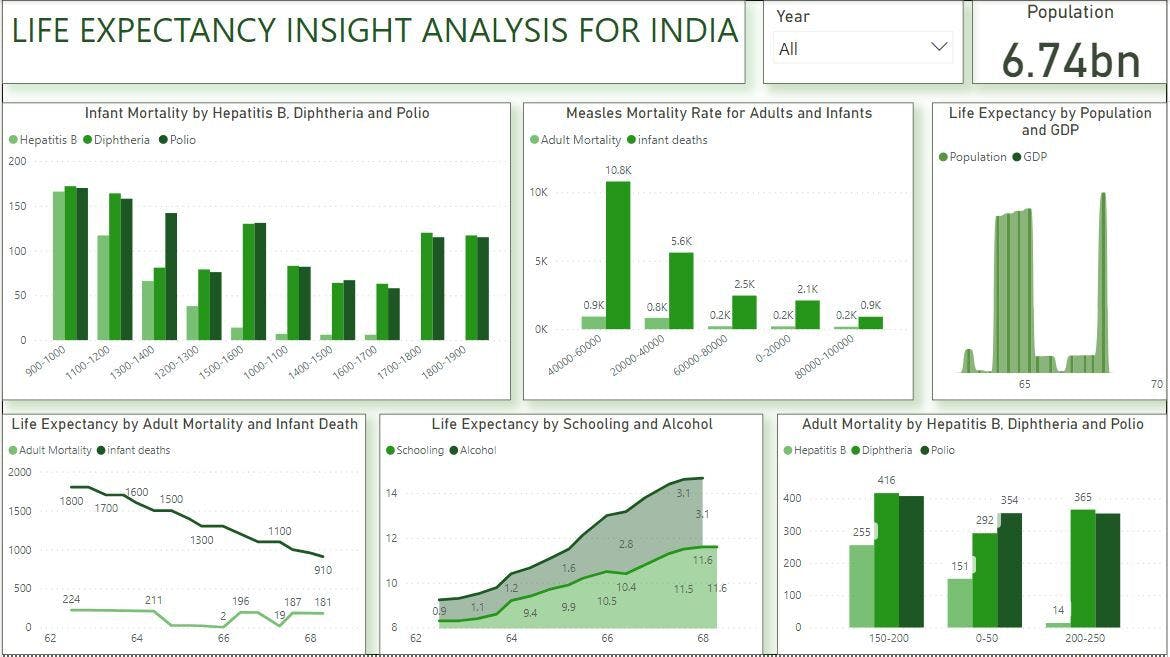
DATA VISUALIZATION
A Simple Dashboard with 1 Card of the Indian Population from the Year 2000 to 2015, 3 column Charts (See Dashboard Below), 1 Line showing Life Expectancy vs Adult Mortality and Infant Death and 1 Area chart showing the Life Expectancy vs Schooling and Alcohol.
CORRELATION INSIGHTS
- BMI, Polio, Schooling, and GDP are all calculated to have a Significant Positive Correlation with Life Expectancy, meaning that Life Expectancy in India increases as they increase on Average, while Alcohol had a positive correlation, it was not closer to 1. While Infant Deaths and HIV/AIDs have a significant Negative Correlation to it in India.
 (PS: Numbers in Bracket are Negative.)
- More than 90% of countries with a Life Expectancy of less than 65 are in Africa.
- We chose Afghanistan as our country of focus for a country with a Life Expectancy of less than 65 and below summarises its Correlation positivity or negativity across various highlighted factors.
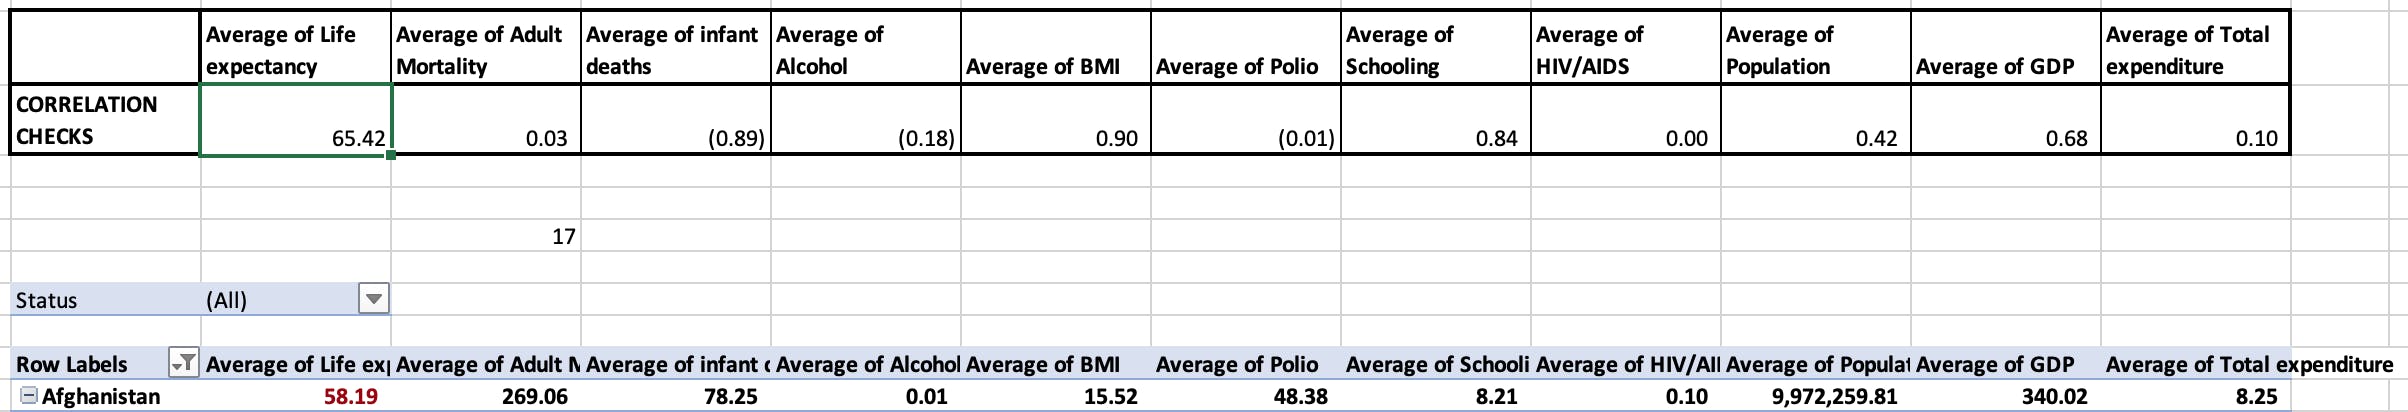 (Numbers in Bracket are Negative.)
Thank You for your time. We will take questions in the comment section below.